Plug Power (PLUG) has announced that it is building a green hydrogen plant at Europe’s second largest port of Antwerp-Bruges and a sell-side firm started coverage of the stock with a “neutral” rating Wednesday. A busy news day.
Let’s check and see the charts and indicators to see if this news will impact the share price.
In the daily bar chart of PLUG, below, we can see that the shares have generated some positive clues for chart watchers. Prices have declined from November and PLUG trades below the negatively sloped 50-day moving average line and the negatively sloped 200-day line.
Trading volume has been active since January but doesn’t show any other subtle clues. The On-Balance-Volume (OBV) line is another story in that there is a bullish divergence with the OBV line making a low in late January and an equal low in May even though prices made a lower low.
The Moving Average Convergence Divergence (MACD) oscillator shows us another bullish divergence with a low in late January and a slightly higher low in May.
In the weekly Japanese candlestick chart of PLUG, below, we can see a big rally from 2020 to a zenith in early 2021. Prices have traded lower and trade below the declining 40-week moving average line.
The weekly OBV line has moved sideways to higher from early 2021 and suggests that buyers of PLUG have been more aggressive for a long time now. The MACD oscillator is below the zero line but close to a cover shorts buy signal.
In this daily Point and Figure chart of PLUG, below, we can see an upside price target in the $28 area.
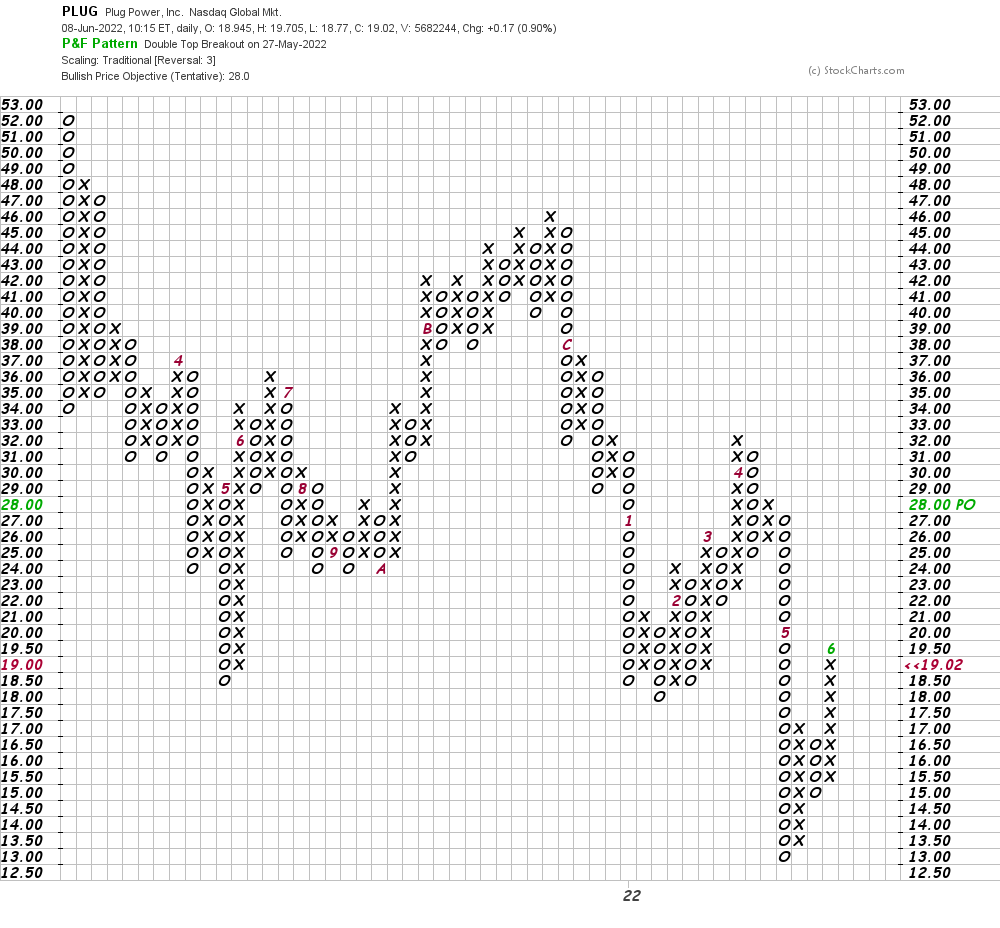
Bottom-line strategy: Aggressive traders could go long PLUG at current levels risking to $16. On the upside we have targets of $28 followed by the low $40s.
Get an email alert each time I write an article for Real Money. Click the “+Follow” next to my byline to this article.