

[ad_1]
The U.S. stock market is experiencing a liquidation panic where everything is getting sold. The good news is such panics usually don’t last long.
Analysis from Rob Hanna of Quantifiable Edges suggests a rare Inverse Zweig Breadth Thrust (ZBT). Although the sample size is small (n=10 since 1926), the bearish implications of the study are clear.
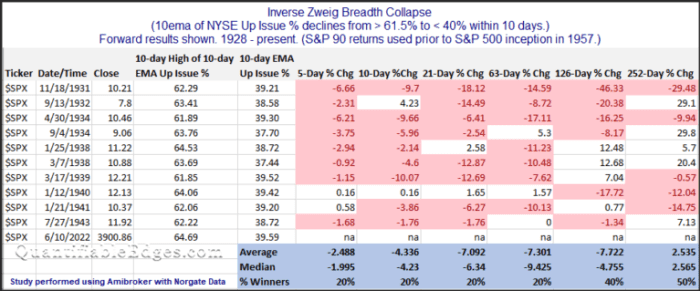
Take a deep breath. Notwithstanding the fact that negative ZBTs were not part of Marty Zweig’s work as detailed in his book, “Winning on Wall Street,” this study is nearing “torturing the data until it talks” territory. While positive ZBTs are rare buy signals, there have been six instances since the publication of Zweig’s book in 1986. Can you really trust the results of a study when the last instance of a negative ZBT was in 1943?
Panic in the air
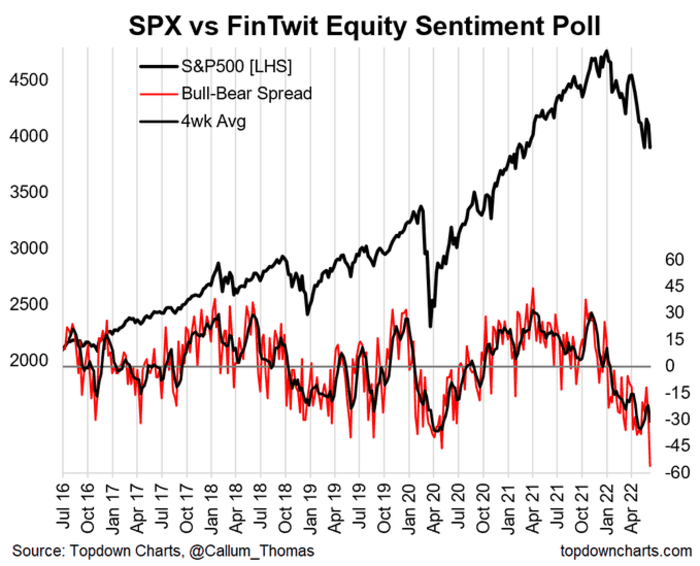
Two weekend (unscientific) Twitter polls are testament to the sense of panic. Callum Thomas has been conducting a weekly poll since 2016, and readings are at an all-time low. The weekly reading of equity bearishness has exceeded the levels seen during the COVID-19 crash in 2020, though the four-week average has not.
Market analyst Helene Meisler conducts a similar weekend poll and the results are net bearish by -20%. In the limited time she has conducted this poll, there were only a few instances when readings reach these levels:
While the sample size is small (n=5), four of the five samples saw the S&P 500
SPX,
rebound the following week. In the single exception where the market showed a red candle, investors saw a “Turnaround Tuesday” rally that led to higher prices for the remainder of the week.
Purely as an anecdotal observation, the respondents in Meisler’s poll seem to have a shorter time horizon than in Thomas’s poll.
Some silver linings
I don’t want to imply that this is “the bottom”, as the U.S. equity market still faces some valuation challenges. But some silver linings are starting to appear in a series of dark clouds.
Let’s begin with the long-term technical perspective. I have highlighted the point that the % above the 200 dma reached over 90% as the market recovered from the COVID Crash in 2020, which created a “good overbought” advance (top panel). The “good overbought” condition petered out in the second quarter of 2021.
In the past, the market has bottomed this indicator reached 15%. It’s now about 20%. It’s getting close. Such pullbacks have also ended when the % above their 50 dma (bottom panel) fell below 20% and this indicator has fallen as far as a sub-5% reading in the past. It’s now there.
“ Technical conditions are consistent with long-term bottoms, though the market still lacks valuation support. ”
In short, technical conditions are consistent with long-term bottoms, though the market still lacks valuation support.
In the short run, the crypto space tanked on the weekend when Celsius halted redemptions and transfers. Not only did the episode spark fears that this was another instance of fraud or Ponzi scheme implosion, but it also had real liquidity implications.
Some crypto investors who had their holdings at Celsius faced with margin calls had the choice of either liquidating their positions or adding U.S. dollars into an institution that was not allowing withdrawals. The silver lining is the performance of cryptocurrencies has been highly correlated with the relative performance of speculative growth stocks, as proxied by ARKK. But is that a positive divergence I see?
Waiting for the Fed
One development that investors are watching is the FOMC announcement on Wednesday, and the event may provide some relief for risky assets. In the wake of the hot CPI print, the market is now discounting a 30% chance of a 75 basis-point hike on Wednesday. As well, it’s discounting a series of rate hikes with the terminal rate at 3.75% to 4.00% in early 2023.
I believe those expectations are far too hawkish. On the question of what the Fed will do this month, just remember the Fed is a bureaucracy and an institution. It is not some trader sitting in front of several screens trading the market and it doesn’t pivot policy based on a single data point. A 50 bps increase is far more likely, though 75 bps hikes are plausible this year.
On the other hand, the terminal rate of nearly 4% may be overly aggressive with the level of the two-year Treasury yield at 3.3%. In the past, the two-year yield has served for another estimate for the terminal Fed Funds rate. In effect, the market is discounting a 3.75% to 4.00% Fed Funds rate next year and a 3.3% in 2024, indicating Fed easing and therefore a recession.
Cam Hui writes the investment blog Humble Student of the Markets, where this article first appeared. He is a former equity portfolio manager and sell-side analyst.
More: With the S&P 500 now in a bear market, despair and capitulation are the next stages of investors’ grief
Also read: This Wall Street legend has lived through every bear market since the 1950s. He says the one coming could hit the S&P 500 with a 30% loss
[ad_2]
Source link


