

[ad_1]
On Tuesday, the nation of Qatar announced the selection of Exxon Mobil (XOM) , TotalEnergies (TTE) , Shell (SHEL) , and ConocoPhillips (COP) as partners in what is expected to be the multi-billion dollar expansion of the world’s largest liquified natural gas project.
Almost immediately, five-star rated (by TipRanks) analyst Stephen Richardson of Evercore ISI upgraded his rating on XOM to “outperform” and took his target price for the stock up to $120 from $88. The stock took back par (The $100 level is referred to as “par” on Wall Street) for the first time since 2014, shortly after the opening bell on Tuesday, and closed up 4.58% for the session, at $103.37, and within shouting distance of the stock’s all-time high of $104.76.
Cleaning Up
On Tuesday, Chevron (CVX) announced through a subsidiary, the signing of a memorandum of understanding with KazMunayGas of Kazakhstan to explore potential lower carbon business opportunities in that country. The terms imply that both firms will evaluate the potential for lower carbon projects in such areas as carbon capture utilization, storage, hydrogen, and methane management. The stock gained 1.91% on Tuesday, to close at $180.20, just short of its all-time high of $180.96 set less than two weeks ago.
Flip a Coin?
So who’s your pick? I have told you mine in recent weeks. I have been long Chevron to gain some exposure to the large scale integrated oil and gas space, but I have been mostly focused on US-based exploration and production. That’s why I have been long APA Corp (APA) , Pioneer Natural Resources (PXD) , and Civitas Resources (CIVI) . For oil services, I have been long Sclumberger (SLB) and it has worked. That said, if not for the current breakout attempt, I would consider flipping out of SLB and into Baker Hughes (BKR) , which has been a slight underperformer.
But Exxon vs. Chevron? Have I been in the right name? Hard to argue with Chevron’s year to date performance of +56.45%. Unless one notices that Exxon is up 72.56% in 2022. Of course if one goes back a full 12 months, it’s much closer… XOM is up 77.93%, while CVX is up 74.68%. It is much closer, and I have been in Chevron that long, but I still lose, even by a smidge.
Looking ahead, Chevron trades at 11 times 12 months forward looking earnings, Exxon Mobil at just 10 times. Chevron trades at 1.83 times trailing 12 months sales, Exxon at just 1.28 times. Chevron yields 3.15%, while Exxon yields 3.41%. This, my friends… is a race being run by two horses galloping side by side.
Fundamentals & Balance Sheets
As of the March quarter, Chevron produced free cash flow of $3.15 per share leaving the firm with a net cash position of $11.7B, and current assets of $44.7B. Measured up against current liabilities of $31.2B, Chevron runs with a current ratio of 1.43. Very healthy. Ex-ing out inventories of $6.5B, Chevron stands with a quick ratio of 1.22. Excellent.
As of the March quarter, Exxon Mobil produced free cash flow of $2.55 per share leaving the firm with a net cash position of $11.1B, and current assets of $77.3B. Measured up against current liabilities of $72.1B, Chevron runs with a current ratio of 1.07. That gets a passing grade. Ex-ing out inventories of $22.2B, Chevron stands with a quick ratio of 0.76. Not so hot. Then again, this might not be such a bad time to hold bloated inventories of oil and gas.
Chevron stands with total assets of $249B, including “goodwill” of just $4.3B and no other intangible assets. Total liabilities less equity amounts to $101.9B including $29B in long-term debt and $5.9B in pension related liabilities. Chevron ended the quarter with a tangible book value of $72.19 per share. At $180.20, Chevron is trading at 2.5 times tangible book.
Exxon Mobil stands with total assets of $354.7B, including no entry for “goodwill” or any other intangible assets. Total liabilities less equity amounts to $178.2B including $42.6B in long-term debt and $18.3B in pension related liabilities. Exxon ended the quarter with a tangible book value of $40.17 per share. At 103.37, Exxon is trading at 2.57 times tangible book.
Earnings
Both firms are expected to report their current quarter performance on July 29th. Chevron is seen posting EPS of $4.75 on revenue of roughly $55B. That would be good for annual earnings growth of 175% on revenue growth of 53%. This would be the fifth consecutive quarter of three digit earnings growth for CVX and the fifth consecutive quarter of double digit+ revenue growth.
Exxon Mobil is seen printing EPS of $2.98 on revenue of $95 to $100B. This would be good for annual earnings growth of 171% on revenue growth of 49% at the high end. This would also be a fifth consecutive quarter of three digit earnings growth and a fifth consecutive quarter of double digit+ revenue growth.
Thought
How close is this? These two run neck and neck in everything. Let’s take a look at the charts.
Chevron Charts
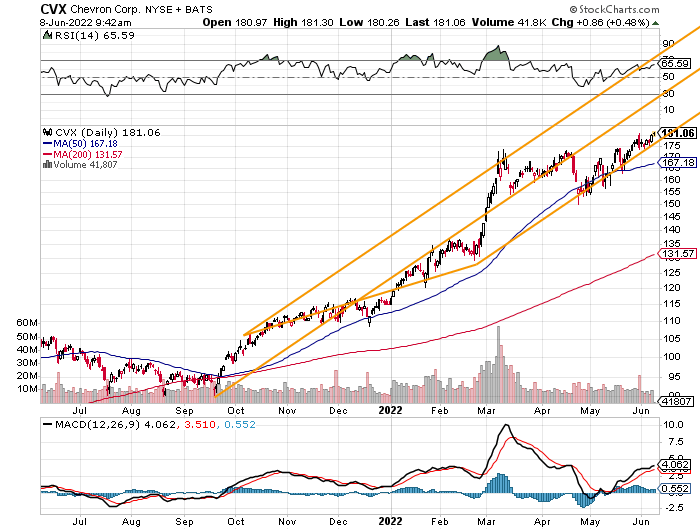
Readers will see through the illustration of this Pitchfork model that Chevron has been in a persistent uptrend since September of 2021. The shares have strayed outside of the lines on occasion, but have largely held within the boundaries of both the lower and upper trend lines throughout. Note that the lower trend line as the stock itself has found loose support at the 50 day SMA.

Readers will see that CVX appears to be mildly overbought if you listen to the full stochastics oscillator. While both Relative Strength and the daily MACD are strong, neither appears overdone to the upside just yet. Note that the stock formed a basing period of consolidation from March through May in response to the last February/early March spike due to the Russian invasion of Ukraine. The stock is currently breaking out from that period of consolidation.
Chevron
– Target Price: $209
– Pivot: $174
– Panic: $166 (break of 50 day SMA)
Exxon Mobil Charts
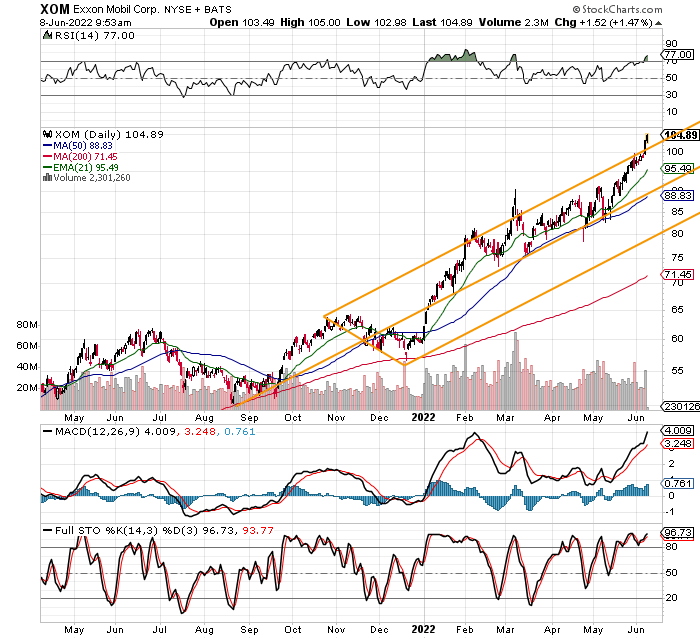
Note that Exxon Mobil has also been trending in a northerly direction, and that while CVX has had trouble hanging onto the Pitchfork’s lower trend line that XOM is currently breaking out past the upper trendline and possibly breaking out of the model entirely.
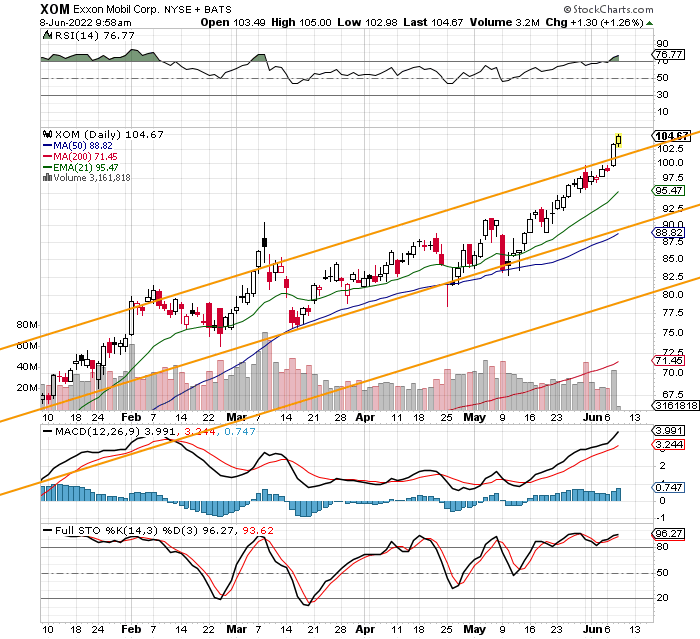
Now, check this out. XOM has no pattern within the pattern. When you zoom in, all you get is a close-up of the same picture. As the shares break-out of our pitchfork model, readers will note that Relative Strength, the daily MACD and the full stochastics oscillator are all clearly sending the same message. XOM is technically overbought at the moment,
Does that mean that XOM has to sell off? Not necessarily. That said, XOM may have to base. Take a look at CVX back in late February. CVX was overbought back then too. It based. Now, it moves toward breaking out again.
My Conclusion
These stocks are very similar. I think that an investor with the means could probably be exposed to both on the long side and do well. I am long CVX, so maybe I am unintentionally biased. I am not selling CVX. My plan is laid out above for all the world to see. As for XOM, I would not mind re-initiating XOM, but I think I want to see if some kind of flat base forms. I think CVX does better short-term from here. I think they both do well, perhaps very well medium to longer term going out a couple of years.
My one worry across the space is that it’s getting crowded. While the Energy sector is still undervalued relative to the S&P 500, it is no longer the best kept secret in equities. The crowd has arrived.
Get an email alert each time I write an article for Real Money. Click the “+Follow” next to my byline to this article.
[ad_2]
Source link


