

[ad_1]
The breakdown in S&P 500 with spike of volume on 13 June 2022 followed by a weak rally up after the Fed’s FOMC pointed to the bearish scenario. The current market development is similar to the global financial crisis in 2008 in terms of both price structure and the market rotation sequence as explained in the video at the bottom of this post.
Using Wyckoff Method to Spot the Silver Lining
After a more than 10% drop in 6 trading sessions, S&P 500 is right at a vulnerable spot where a stock market crash could easily be triggered. Over the weekend, Bitcoin broke below the support at 20000 suggested a continuation of the risk-off mode into the coming week.
However, there is still a silver lining for the looming stock market crash when adopting the Wyckoff trading method to spot the tell-tale signs for a potential short-term rally. Refer to the chart below.

Since the breakdown of the short-term support at 4080 on 9 Jun 2022, shortening of the thrust to the downside was observed (as annotated in blue) along with decreasing of the volume suggested exhaustion of the down momentum.
S&P 500 is currently testing the oversold line of the down channel, which could prone to a relief rally out from the oversold condition. The rebound off the channel oversold line happened in the past on 24 January 2022, 24, February 2022 and 20 May 2022.
The two price targets based on the Point and Figure chart are 3900 followed by 3650. In May 2022, after the first price target of 3900 was hit, S&P 500 stopped the down move and consolidated for one month. The fulfilment of the second price target at 3650 provides a condition for S&P 500 to attempt to rally when interpreting with the technical details as explained above.
Even if S&P 500 starts to rally up as illustrated in the green path, it is crucial to monitor how the price reacts at the key levels such as 3800 followed by the gap resistance zone near 3900 (annotated in red line). Any failure along the way could signal the end of the rebound and the beginning of an impulsive down move.
Should the short-term rebound fail to materialize, a break below the recent low at 3640 and a commitment below the oversold line of the down channel could trigger a capitulation, which could lead to a stock market crash similar to 2008’s situation as detailed in the video at the bottom of this post.
Bullish Divergence Between S&P 500 and The Market Breadth
A bullish divergence between S&P 500 and the market breadth (percent of stocks above 50-day average) was observed, as shown in the chart below.
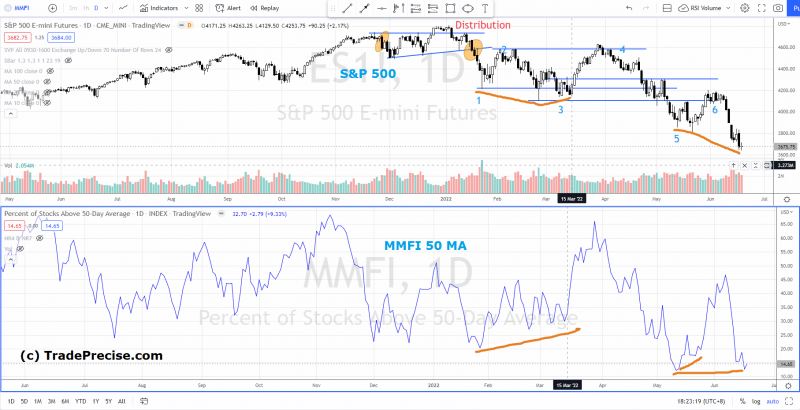
A bullish divergence was observed near end of January 2022 till mid of March 2022 (annotated in orange) where the market breadth formed a higher low while S&P 500 formed a lower low. Subsequently a strong rally kicked start after the bullish divergence.
Similarly, between 12-20 May 2022, a bullish divergence was formed followed by a relief rally tested the resistance zone near 4200.
Now, a potential bullish divergence is unfolding from May till now. A meaningful rally in S&P 500 would mark the third successful bullish divergence.
Stock Market Crash Comparison 2022 vs 2008
When the silver lining fails along the way or even at the beginning, S&P 500 is likely to enter into market crash mode similar to the global financial crisis in 2008.
Watch the video below to find out the similarities of the stock market crash in 2008 from the price structure to the market rotation sequence.
The sign of weakness in the energy sector (XLE) started last week further strengthened this market crash analogue. Visit TradePrecise.com to get more stock market insights in email for free.
This article was originally posted on FX Empire
More From FXEMPIRE:
[ad_2]
Source link


